Public Data Portal & Visualizations
NSLVE creates data visualizations and interactive tools that are designed to provide new ways of looking at data. Browse below to explore NSLVE data and more:
NSLVE Data Portal
This tool allows you to explore 3 election years of NSLVE data (2016, 2018, and 2020).
2020 College Student Vote Potential
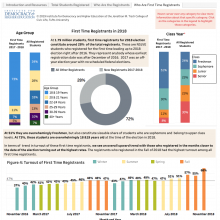
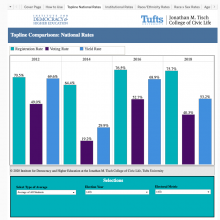
2018 Student Registration Timeline
When did college students register to vote during the 2018 election season? This tool offers a look at the data, including a breakdown of the numbers, a look at who the registrants were, and a deeper dive into first-time registrants.
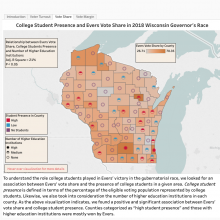
College Vote Potential in the 2018 Wisconsin Gubernatorial Election
This interactive tool provides an exploration of the role of college student-heavy counties in the 2018 gubernatorial election in Wisconsin. In a race that was decided by less than 31,000 votes and in a state with nearly 350,000 college students, this data tool offers insight into the potential influence of college student voters.
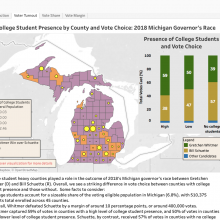
College Vote Potential in the 2018 Michigan Gubernatorial Election
In Michigan, college student-heavy counties played a role in the outcome of the 2018 gubernatorial election. Use this tool to explore the data and look at county-by-county analysis.
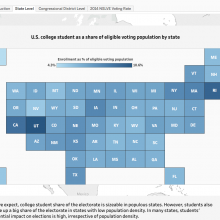
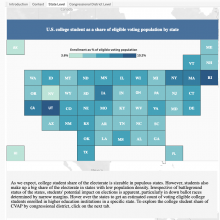
College Student Vote Potential in 2018: Where Might Participation Have the Most Power in the Midterms?
This NSLVE data tool offers an interactive look at the potential influence of college student voters in the 2018 U.S. midterm elections, including as a share of eligible voting population by state, and for the first time, by congressional district.
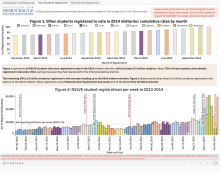
2014 Student Registration Timeline
When do college students register to vote for midterm elections? Using NSLVE data, we present an interactive tool that allows you to explore a timeline of student registration and analyze the data across demographics.
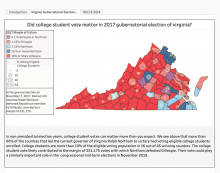
Virginia Student Vote Potential
This analysis looks at the role of college students in the 2017 Virginia election, looking not at how individuals voted (which is private information) but at the location of colleges and student populations in Virginia's counties.
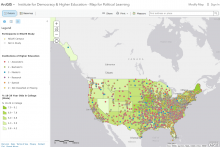
Interactive Map: Placing Political Learning in Context
This tool is an interactive map to help students, faculty, and institutional leaders make sense of key data that may help or hinder political engagement.